Which site has the best fantasy football projections?
December 18, 2014
Last week, we wrote about the accuracy of ESPN’s fantasy football projections and found that, well, they’re not perfect. Fortunately, ESPN isn’t the only prognosticator in town. FantasyPros serves as an aggregator of all things fantasy football and even provides the weekly projections of seven different sources.[1]
With championships starting this week, it seemed like a good idea to compare the accuracy of these seven sources in order to determine which is best to trust before setting your lineup.
We’ll be using the same methodology as before and will only look at fantasy relevant players,[2] which this time are specific to each expert. For instance, if ESPN says Shaun Hill is the 20th best QB this week, and numberFire says he’s 21st, he will be included in that week’s data for ESPN, but not numberFire.
Note that FantasyPros does not include projections for defenses, so we won’t be looking at them in this analysis.
ESPN
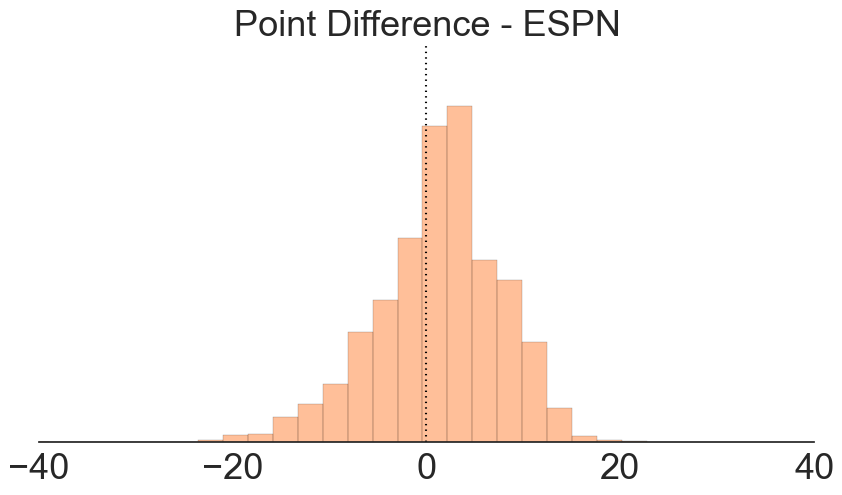
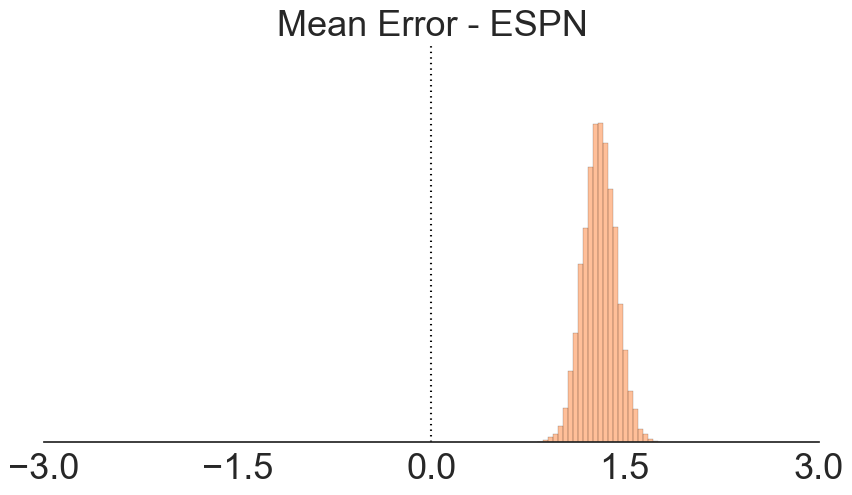
95% Confidence Interval: 1.3 +/- 0.25
Since we already looked at ESPN’s accuracy last week, this chart is mainly a refresher that ESPN over-projects. The first chart shows the actual distribution of errors; that is, the projected score minus actual score for each observation.[3] The second is the standard error of the mean for the distribution. Because zero doesn’t fall within the 95% confidence interval, we’re able to say that ESPN’s projections are, on average, biased.
Pro Football Focus
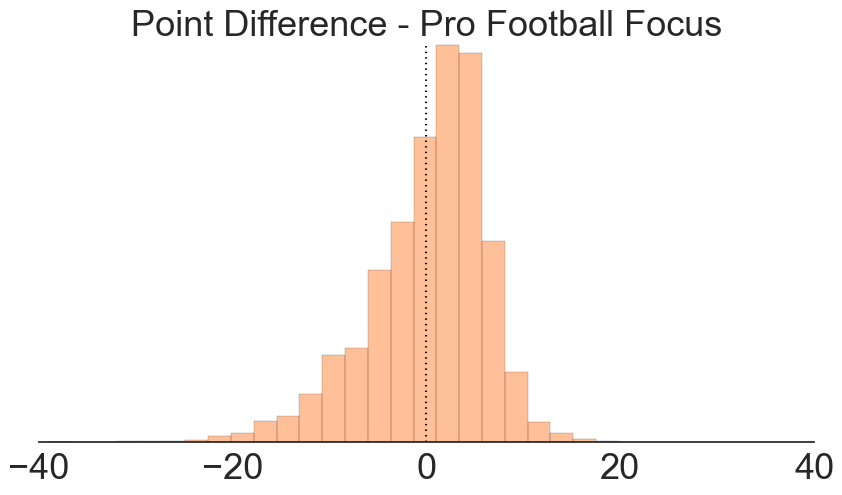
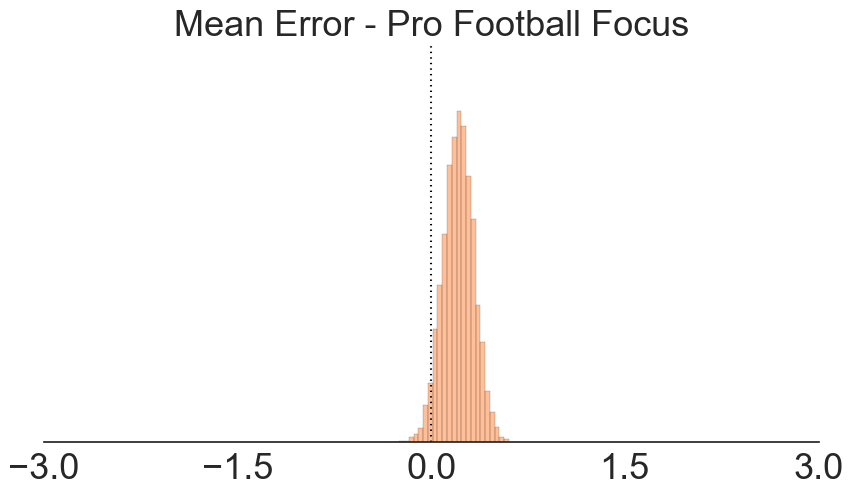
95% Confidence Interval: 0.21 +/- 0.24
Pro Football Focus looks a little bit different than ESPN. There’s a much larger mass near zero in the first chart. This means that the observed errors are frequently only a couple points off. Looking at the standard error of the mean, it becomes clear that Pro Football Focus’ projections are much better than ESPN’s. So much so that our 95% confidence interval contains zero, meaning Pro Football Focus’ projections are, on average, indistinguishable from zero - we cannot say they are biased.
Dave Richard, CBS Sports
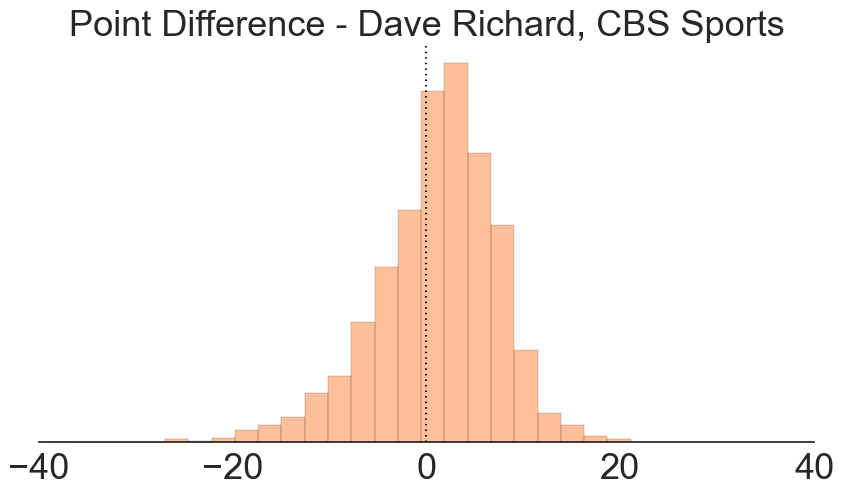
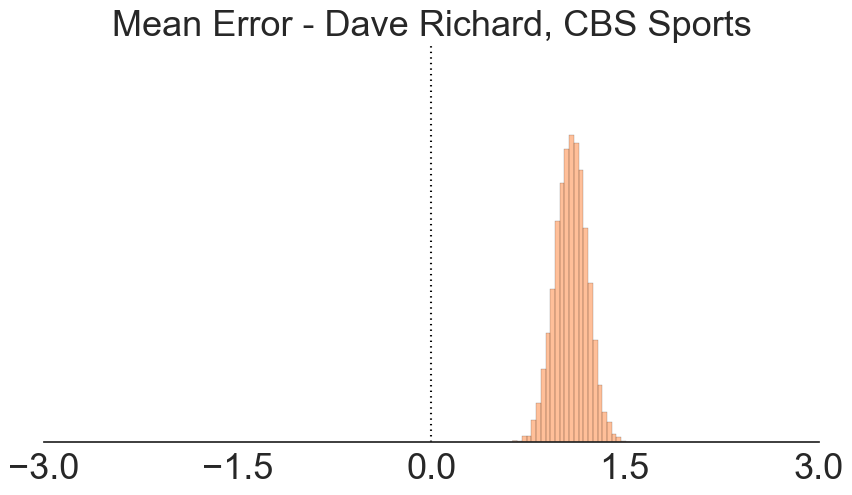
95% Confidence Interval: 1.08 +/- 0.24
Dave Richard (CBS Sports) has error distributions closely resembling those of ESPN. Not much to say here - Dave tends to over-project as well, but not as much as ESPN.
Bloomberg Sports
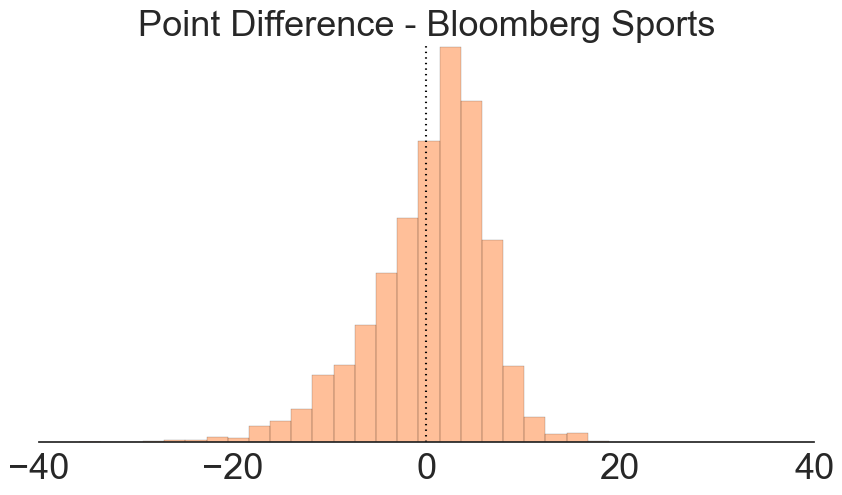
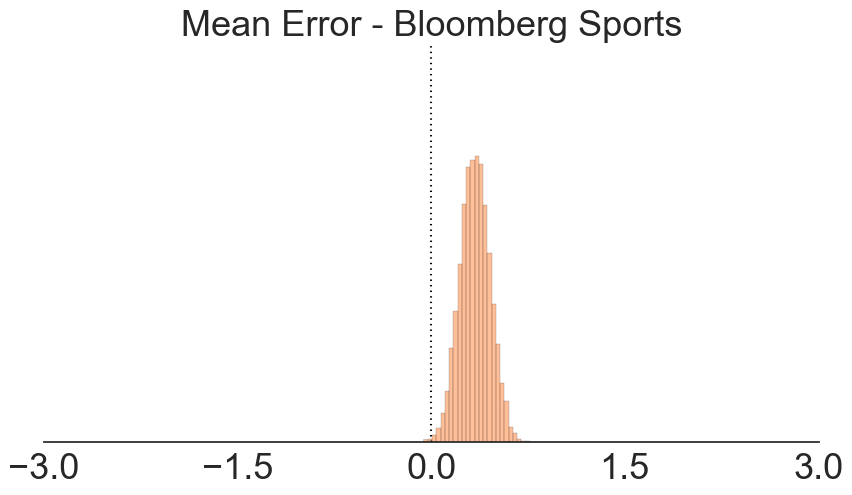
95% Confidence Interval: 0.34 +/- 0.23
Oh so close! Bloomberg Sports just misses having projection errors that are indistinguishable from zero. While we can say their projections are biased (on average), they aren’t biased by much.
FFToday
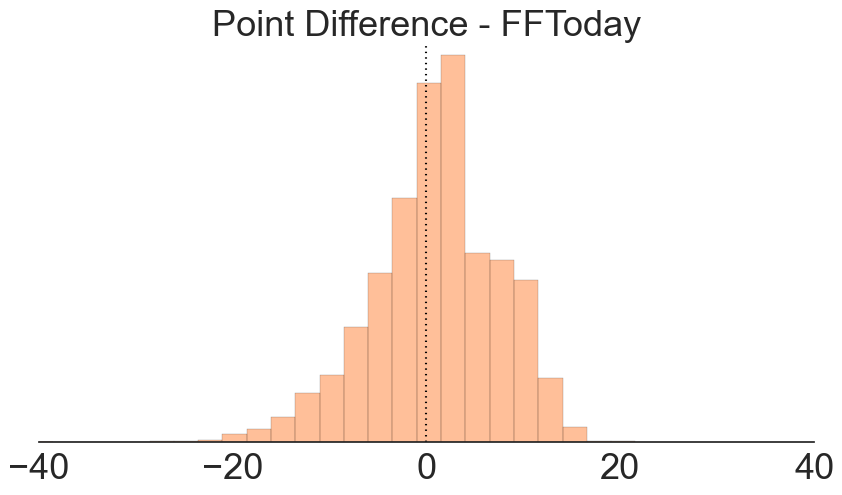
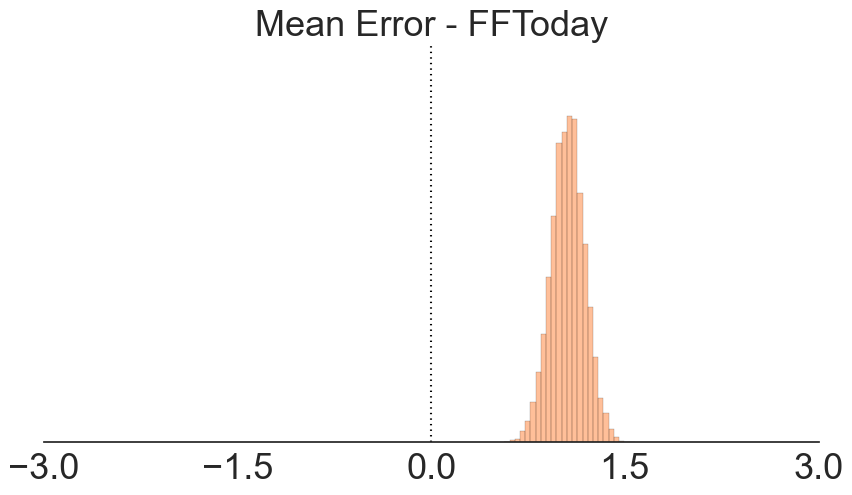
95% Confidence Interval: 1.06 +/- 0.26
FFToday looks similar to ESPN and Dave Richard. They also over-project.
Jamey Eisenberg, CBS Sports
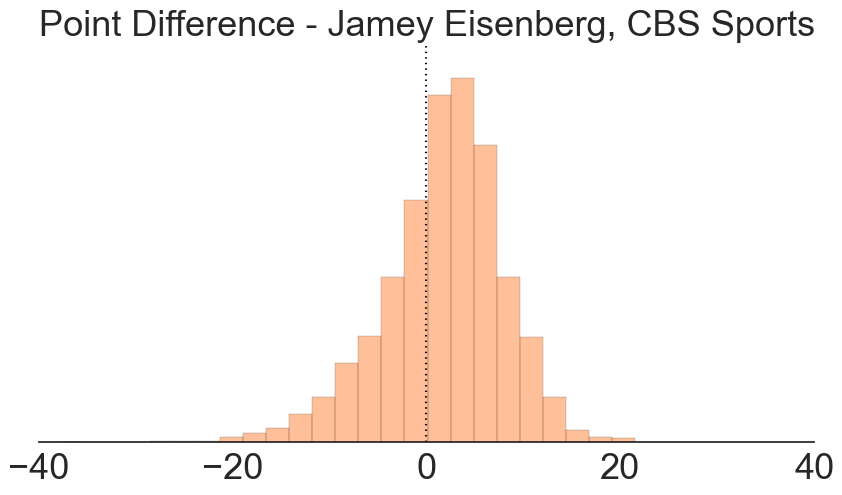
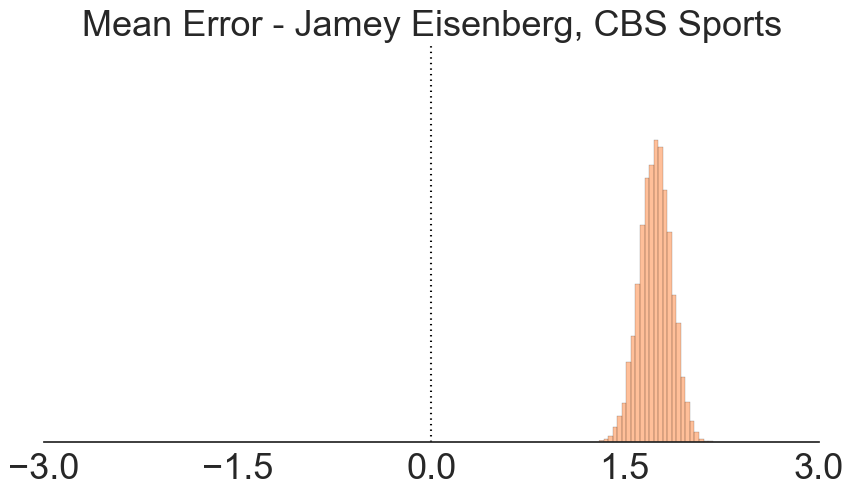
95% Confidence Interval: 1.74 +/- 0.25
Jamey Eisenberg (CBS Sports) does the worst of the seven sources available on FantasyPros. Both he and his colleague Dave Richard over-project on average.
numberFire
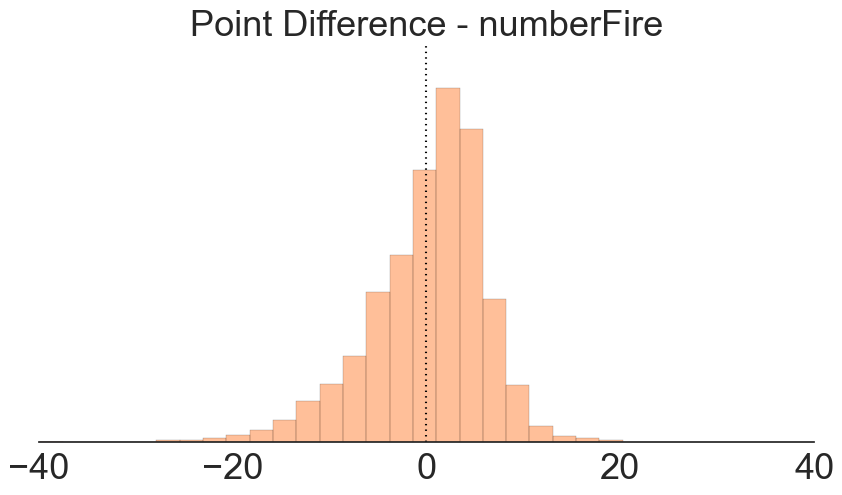
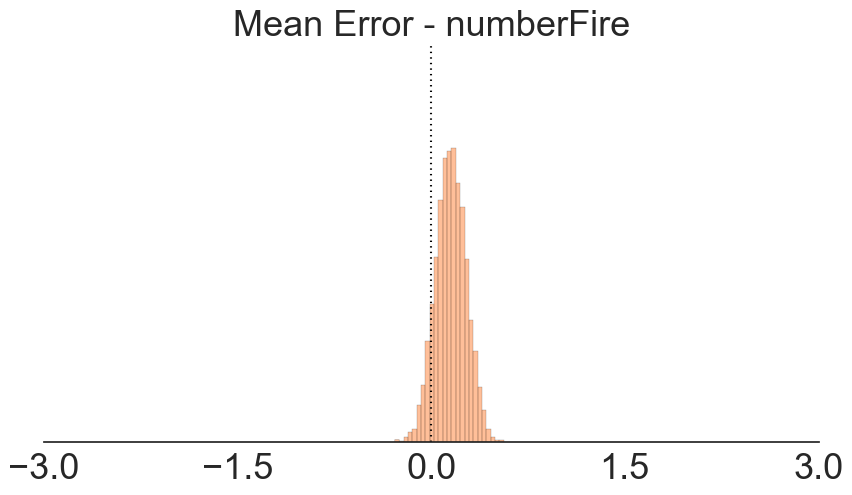
95% Confidence Interval: 0.15 +/- 0.23
numberFire looks very similar to Pro Football Focus; pretty damn good - another site whose projections we cannot say are biased.
Are some sites better at certain positions?
More interesting than just straight comparison is determining the strengths and weaknesses of each site.
Below, we use small multiples of histograms to compare all experts by position (except D/ST, which isn’t available on FantasyPros). Each of our seven experts is a row, while each position is a column (and color). All charts are on the same scale and centered at zero, allowing you to quickly scan through and spot changes.
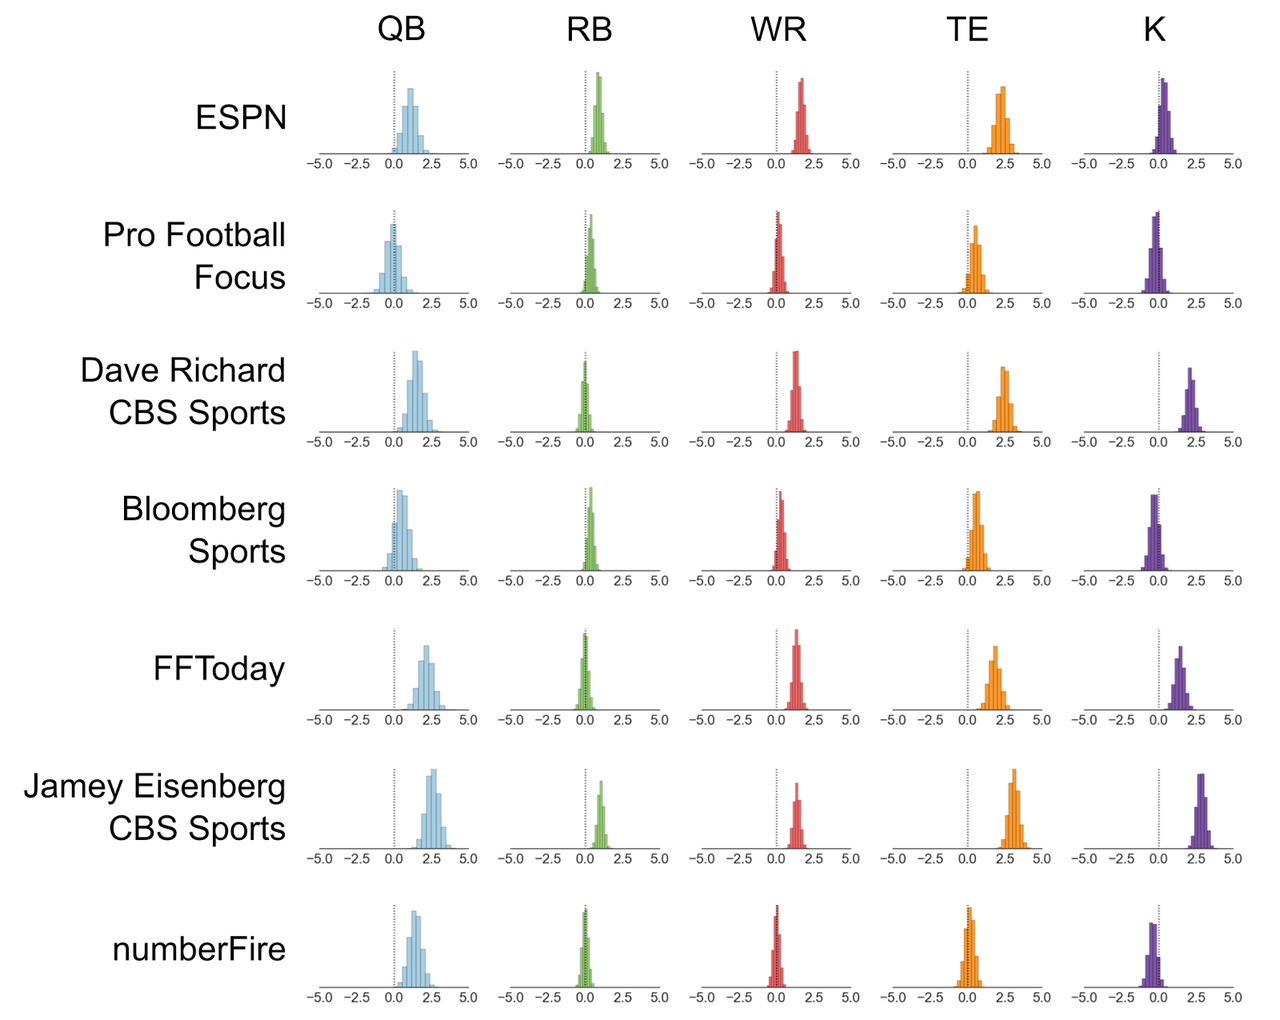
By scanning on a row by row basis, it’s clear the distributions move around. There are two possible explanations for this: 1) Each expert struggles to project consistently across positions or 2) Each expert is actually being bit by the same unanticipated player performances. Scanning on a column basis, you’ll notice that the shifts follow a similar pattern in each column, giving us more evidence to suggest that some player performances are simply unpredictable.
Surprisingly, while some experts might be biased overall, they’re still strong at certain positions. For instance, look at Dave Richard’s chart for RBs - almost perfectly centered (which is really good). Additionally, while Pro Football Focus is unbiased overall, they excel at predicting QBs compared to our other sources.
One takeaway from all of this is that the pay sites (Pro Football Focus, numberFire, and Bloomberg Sports) are actually better than the free ones, especially within individual positions. I didn’t expect there to be such a clear difference.
Another is that accurate predictions are hard to make.
Update: numberFire's weekly projections are actually within the free section of their site.
[1] Dave Richard (CBS Sports), Jamey Eisenberg (CBS Sports), ESPN, numberFire, Bloomberg Sports, FFToday, and Pro Football Focus
[2] We defined “fantasy relevant” as each week’s top 20 projected QBs, 60 RBs, 60 WRs, 20 TEs, 15 Ks, and 15 D/ST. Assuming a 10 team, standard roster league, we felt these were the players that really mattered for projections.
[3] Each observation is a game for a player.