Who's the most underpaid player in the NBA?
July 2, 2014
Congratulations to the San Antonio Spurs for winning the NBA championship and blessing us with beautiful basketball during the NBA finals. The Spurs have proven that basketball is a team game and their unique approach will surely be assimilated by many of the other NBA franchises.
How do you build such a great team? With so many different variables come to play such as chemistry, coaching, player development, talent, culture, specialized skills, etc, this quickly turns into a very complex problem. Ideally, we would want to create and analyze these variables to help inform our team’s decision making process on which players to add to maximize our chance of winning a title. But a lot of these variables are hard to quantify even with the proliferation of SportVU data and new neuroscience tests for athletes. As opposed to trying quantify all of these variables and developing an overly complex model, lets try to take a simpler approach and solve the problem with readily available data.
In this analysis, we’ll focus on the win shares statistic developed by basketball-reference.com. Similar to its moniker, this stat tries to reflect how much each player contributes to his team’s wins and is closely tied to the offensive and defensive efficiency of each player. To try to gauge the efficacy of this stat, lets take a look at the top 5 players in the NBA this past season.
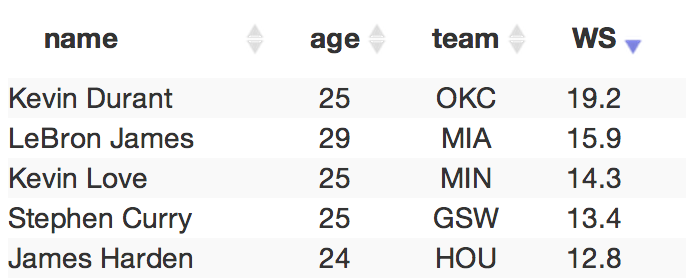
Kevin Durant and LeBron James were 1 and 2 in the MVP voting this year while the other three players are all considered superstars in this league. So far so good. I’ll spare the worst 5 players by name although a very recent #1 overall pick with the initials A.B. made the list.
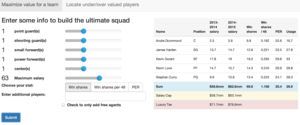
Unless you’re the Miami Heat, it is not really feasible to sign all of the top players in the NBA due to salary cap limitations. Hence, we will need to be a little savvier in analyzing these players and think a little more about value in order to build the best team. Given a limit to how much money we can spend, lets try to find players that outplay their salary using our win shares statistic.
First, lets get a better understanding of how win shares are distributed across the NBA.
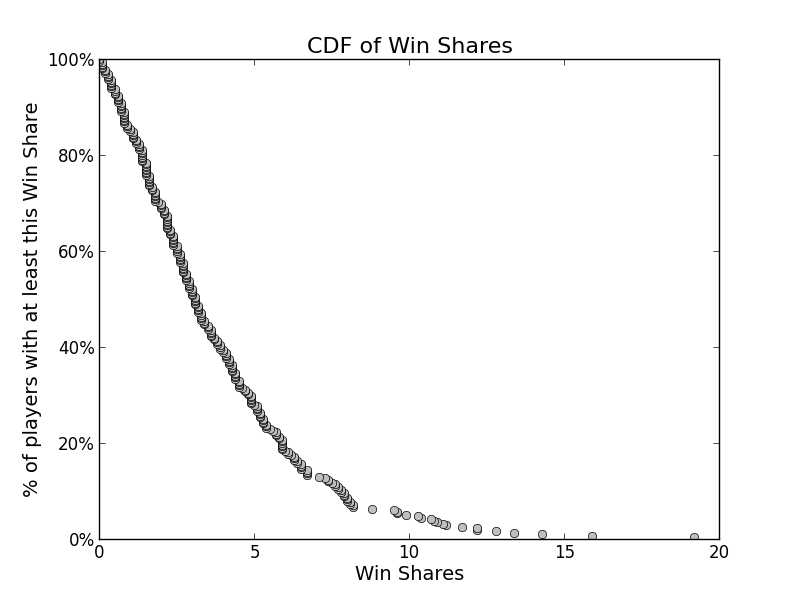
This is a cumulative distribution function that gives us a lot of insight on the spread of win shares throughout the NBA. In the lower right we can see our top 5 players including our “outlier,” Kevin Durant, at about 19. We also can see that 80% of the NBA has a win share below 5! The massive dropoff is eerily similar to an exponential distribution. Here is the same plot with Win Share on a logarithmic scale:
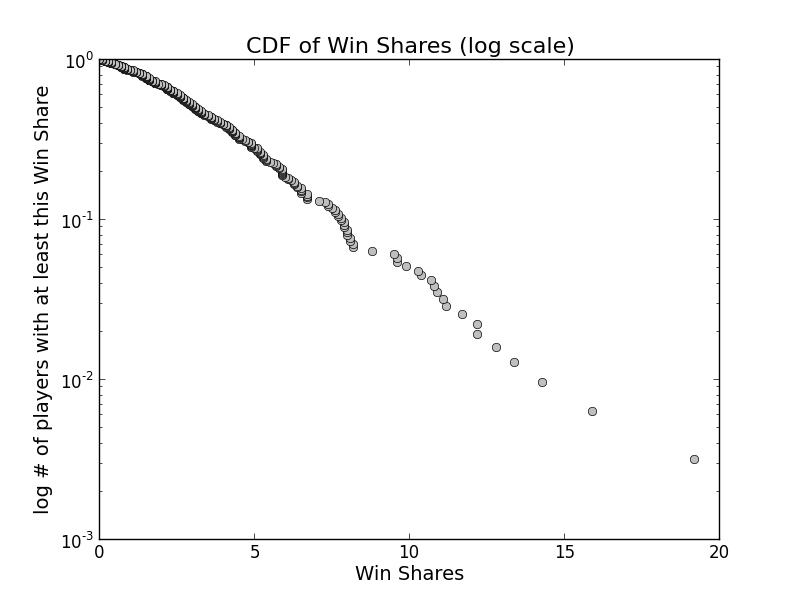
Ah, very nice line; we could definitely model that well with an exponential distribution.
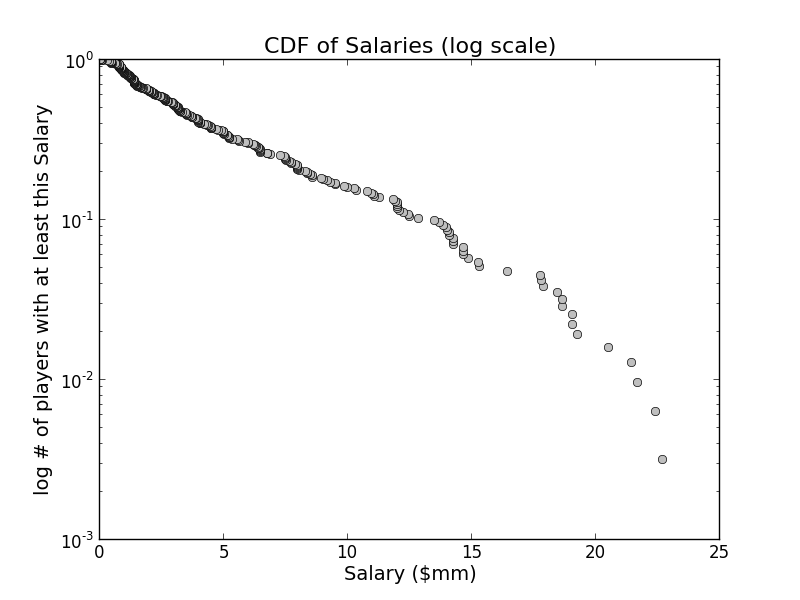
Okay, now lets take a look at how salaries are distributed across the NBA for the past 2013 - 2014 season directly next to the same graph on a log scale:
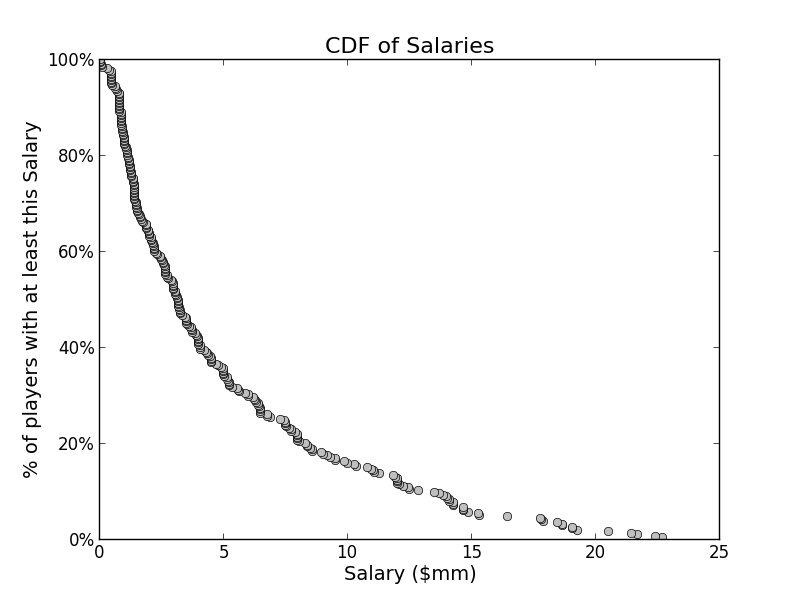
While there is less players at the very highest salaries than a fit to an exponential distribution would suggest (explanation forthcoming), an exponential distribution still fits pretty well here.
What is really interesting about the seeming dropoff on the log scale plot is that the NBA also has a maximum salary limit for players based on years in the NBA and the level of the salary cap! If the salary was not restricted, I would be willing to bet that the distribution would fit a lot closer to an exponential function.
In a perfect world, the player with the highest salary should be the best performer and the player with the lowest salary should be the worst performer. Of course this isn’t the case and leads to a lot of NBA players being mispriced. Some are considerably underpriced while others are making out like the Black Stars. Our goal should be to acquire the most underpriced assets available on the market!
How should we determine value now that we know that both salary and win shares are exponentially distributed? Given that they have the same distribution, we can easily convert their WS metric into an expected salary metric and can determine whether they played up to their contract! Luckily for us, exponentially distributed variables have a nice feature for normalizing by calculating the mean of the distribution. To convert our WS metric into an expected salary, we multiply by the ratio of the means.
Here is an example: In the 2013-2014 NBA season, the average salary was $4.38mm while the average win share was 2.79. Our NBA MVP, Kevin Durant had a salary of $17.8mm and win share of 19.2. We can convert his WS metric into an expected salary by multiplying 17.8 by the market rate for each WS (4.73/2.79) to get $29.7mm. Kevin Durant is underpaid by $11.9mm!
Such a simple calculation but proves to be quite effective. Here we performed a similar calculation for every NBA player and graphed their WS vs. salary on log scales.
The dotted line represents where a player’s salary matches that player’s performance. All dots above the line are players that are undervalued while all dots below the line represent players that are overvalued. As a spot check, we can take a look at two players that signed to new contracts on the first day of free agency.
Jodie Meeks was signed by the Detroit Pistons for a 3-year deal worth about $6.5mm a year. According to our analysis, we would expect Jodie Meeks to receive $6.95mm a year. Seems like a very fair transaction for all parties! Next, lets take a look at Marcin Gortat. He signed a 5-year deal worth $60mm. From our visualization, we can see that we would expect him to earn $12.5mm a year based on his performance! We’ll save the analysis for how many a years a player should receive on a contract for another day.
Finally, we’ll take a look at the ongoing negotiation for Lance Stephenson, it has been reported that the Pacers offered him a 5-year contract at ~$9mm a year. The Lance Stephenson camp believes he is worth a lot more. Who is right? From the data, we would expect Lance to earn an annual salary of about $11.4mm, roughly 27% more than the offer price. Of course, we all know Lance Stephenson is no saint and maybe a ~30% discount is appropriate.
This tool is extremely helpful to give us a gauge on a players value but doesn’t quite answer our question on how to build a great team. In our next post, we will take a different approach where we’ll try to maximize the win share of our team while staying below the salary cap.