Are ESPN's fantasy football projections accurate?
December 9, 2014
“ESPN’s fantasy football projections are way off. They're projecting Kelvin Benjamin will score 18.4 points in my league. He's only scored over 18 points twice, and one of those times was 18.2 points. He averages 13 points a game. How do they come up with this stuff?!“
That was something I casually said at work one day before week 9.
At Datascope, these kind of statements (and others) spark fierce debate and quickly escalate into bets. As soon as the words left my mouth, Dean was there, right hand extended; a six-pack bet was on the table.
Dean believed that ESPN's projections are, on average, accurate — that the difference between ESPN's projected scores and actual scores is not significantly different than zero. I didn’t have a strong enough opinion to bet, but Mike couldn’t pass up another opportunity to beat Dean, so he took it.
Given that fantasy football championships are near, it seemed like a fun question to answer - how accurate are ESPN’s weekly projections? Thankfully, ESPN has pages for their historical projections and weekly scoring. Mix in a little code, and we're able to answer the question pretty easily.
Here’s what things look like through week 14:
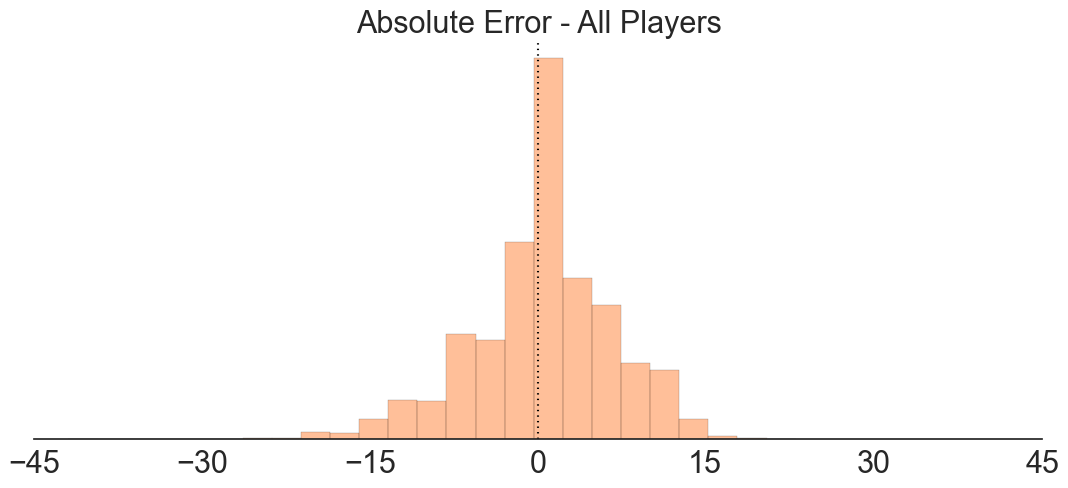
Above is the distribution of absolute errors for all players ESPN projected to score at least one point.[1] Negative values mean ESPN under-projected, positive values mean they over-projected. Based on this, it looks like ESPN might over-project slightly, but that distribution is pretty close to being centered around zero. To determine whether the projections really are biased, we need to test for statistical significance.
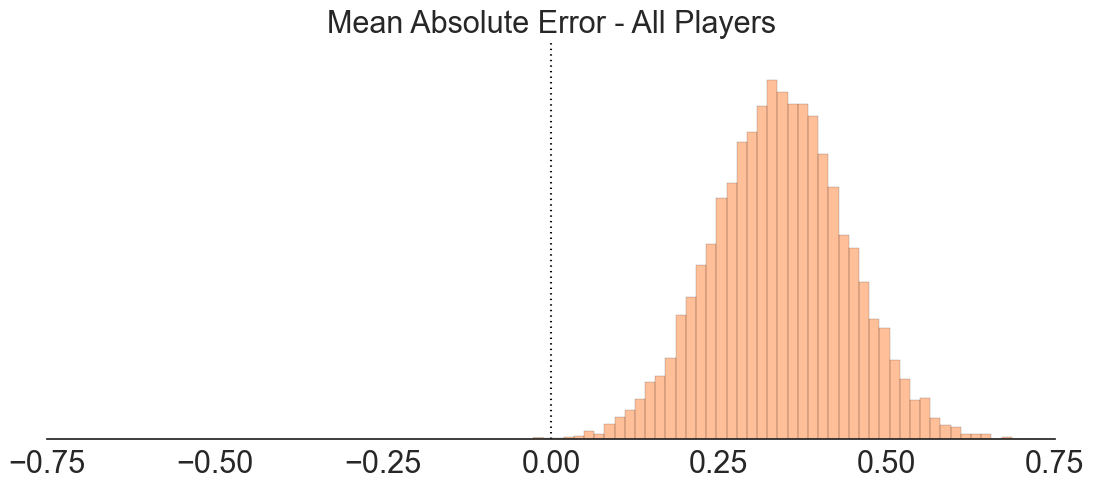
The chart above shows a bootstrapped estimate of the mean absolute error. With bootstrapping, we create many simulations of our observed data by randomly sampling from it (with replacement). For each simulation, we take the mean of the absolute errors. The resulting distribution (above) is the standard error of the mean, in this case giving us a 95% confidence interval of 0.34 +/- 0.2. If zero were to fall within our 95% confidence interval, we would say that ESPN’s projections are, on average, indistinguishable from zero.
We probably don’t care about all projections though. In most fantasy football leagues, only about 180 players are “owned” at a given time. For the purposes of the bet, we really care about “fantasy relevant” players; that is, players where the projection is relevant to determining who you sit or start.[2]
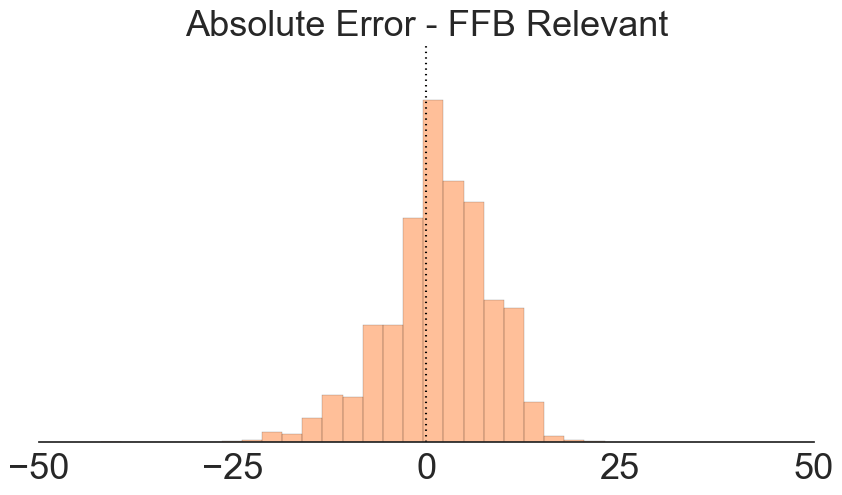
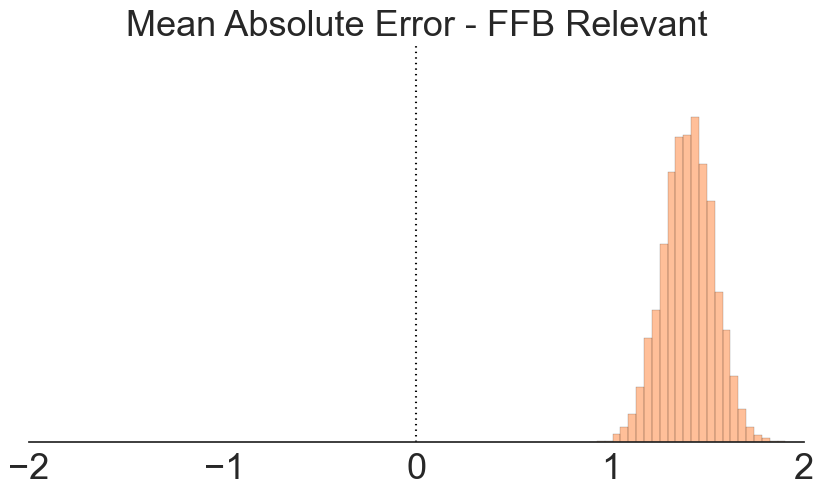
The first chart shows the absolute error distribution for fantasy relevant players, while the second shows the standard error of the mean for that distribution (again using bootstrapping). We can see that the standard error of the mean shifts further to the right, this time with a 95% confidence interval of 1.40 +/- 0.25.
Whether we look at all players or only fantasy relevant players doesn’t change the results. On average, ESPN over-projects.[3]
That settles the bet — ESPN over-projects fantasy football points. Mike wins. Sorry, Dean.
The end? Nope.
A lesson in bias
While the bet’s officially over, we’ve only looked at the absolute error — the difference between projected points and actual points scored. One issue with this approach is that it doesn’t take the underlying projection into account.
For instance, imagine Matt Forte was projected to score 20 points while Ka’Deem Carey (Forte’s backup) was projected to score one point. If Forte scores 19 points and Carey scores zero, both players have an absolute error of one point. However, one could argue that the near-miss on Forte’s total is more impressive.
An alternative approach would be to look at the relative error, which normalizes the absolute error against the prediction.[4] Using the previous example, Forte’s relative error is 5% while Carey’s relative error is 100%.
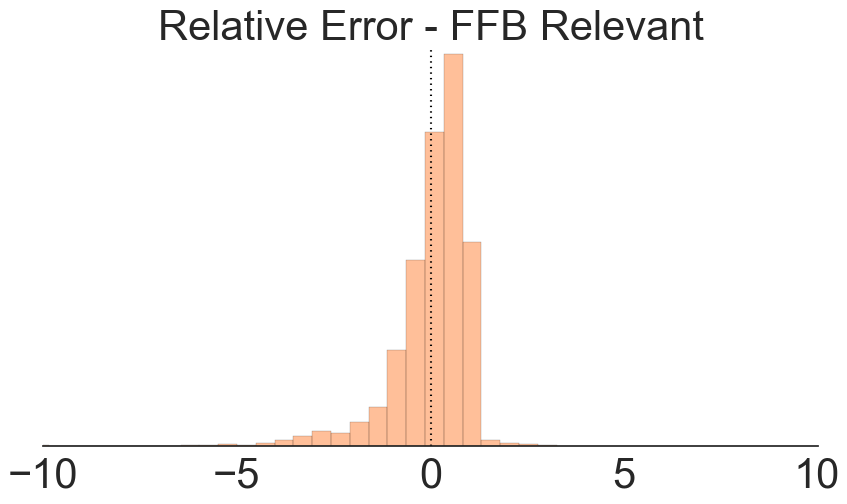
Here’s what things look like if we look at the relative error for fantasy relevant players.
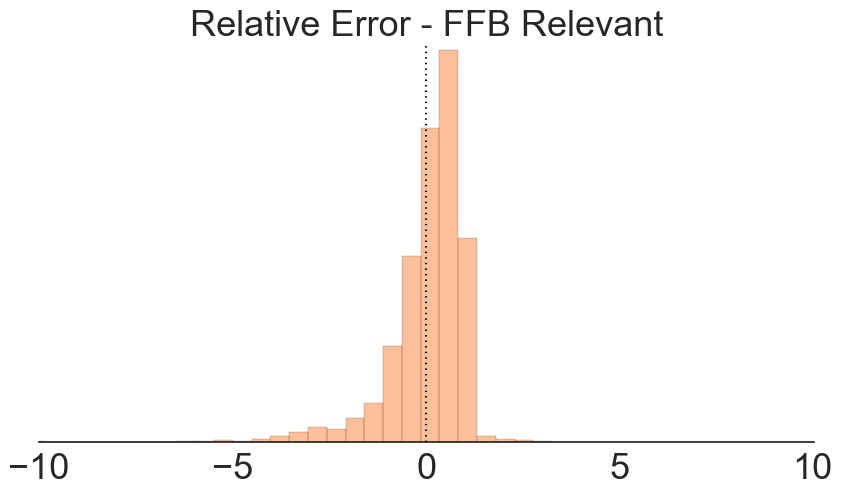
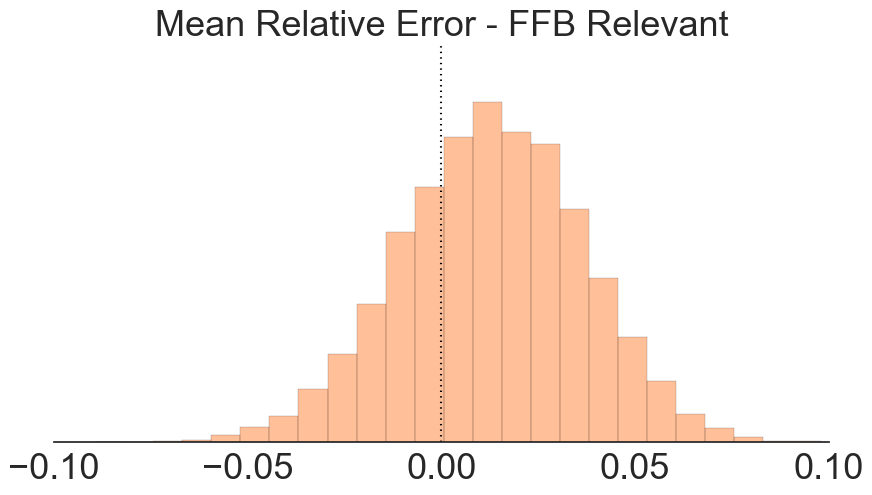
That changes things completely! The first chart shows the distribution of the relative error, while the second shows the standard error of the mean for the relative error. This time, our mean relative error distribution heavily overlaps zero, meaning that ESPN’s projections are accurate. Dean wins!
Wait, what happened?
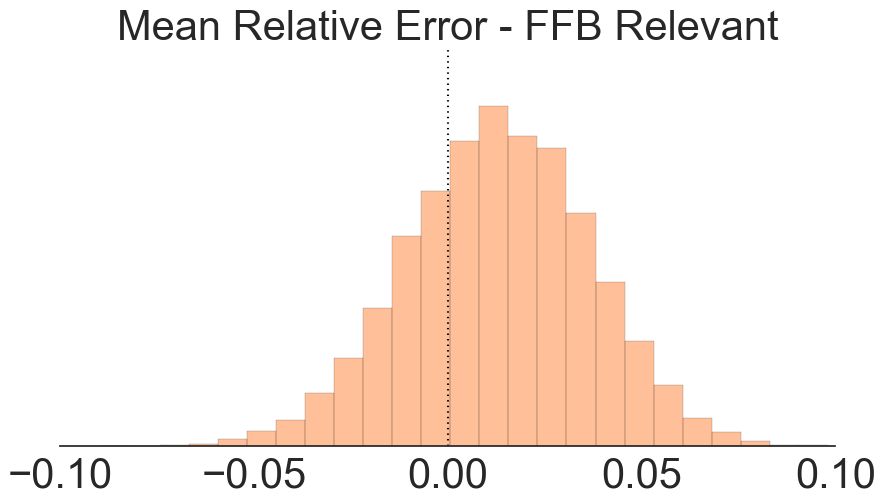
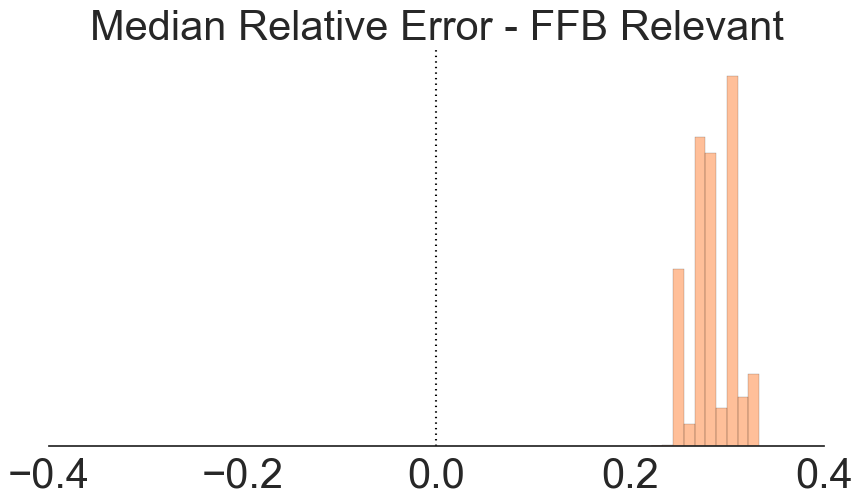
Above we’ve added a bootstrapped estimate of the median relative error.
Looking at all three, the story becomes clear. In the first chart, we see that the relative error distribution is nearly centered around zero; however, while there’s more mass on the positive side, there are some large negative values. When we look at the standard error of the mean (center), the larger negative values cancel out the mass of small positive values, creating a nice distribution around zero. Nonetheless, in the last chart, we see the standard error of the median is consistently 0.25 or higher, meaning that half the time, ESPN over-projects by at least 25%.
Which brings us to an important question: how do we define bias? Well, it depends on what we want. In this case, the average relative error of ESPN’s projections is indistinguishable from zero, but ESPN over-projects 60% of the time!
This shows the importance of knowing the underlying distribution of your data. Since fantasy scoring is not normally distributed, one could argue that the mean should not be used due to the long tail of the distribution making the mean a poor measure of the center. Depending on your use-case, the median might be better suited.
[1]\( \text{Absolute error} = \left( \text{projected fantasy points} - \text{actual fantasy points scored} \right) \)
[2] We defined “fantasy relevant” as each week’s top 20 projected QBs, 60 RBs, 60 WRs, 20 TEs, 15 Ks, and 15 D/ST. Assuming a 10 team, standard roster league, we felt these were the players that really mattered for projections.
[3] Stated differently: Mike beat Dean. Again.
[4]$$\text{Relative error} =\frac{\text{projected fantasy points} - \text{actual fantasy points scored}}{\text{projected fantasy points}}$$


